The Inspector
What Is It?
Babylon.js inspector is a visual debugging tool created to help pinpoint issues you may have with a scene.
For a video overview of the inspector, check out Introduction to the inspector - video series.
The inspector offers multiple tools like:
- A hierarchical view of your scene
- Multiple property grids to let you dynamically change object properties
- Specific helpers like the skeleton viewer, etc.
Its interface uses two panes:
- The scene explorer pane
- The inspector pane
It can be called using:
scene.debugLayer.show();
The two panes can also be opened in an embedded mode:
scene.debugLayer.show({embedMode: true,});
Scene explorer pane
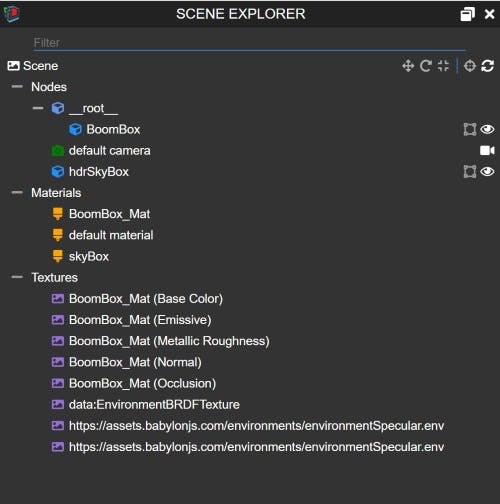
The scene explorer displays a hierarchical view of your scene. You can filter by name in the filter bar if you want to find a specific entry.
By clicking on a line you will select it and the inspector will automatically update to reflect the properties of the selected item.
Some entities offer shortcuts to contextual actions.
Scene actions

The scene shortcuts are the following:
- The first 3 actions will turn on a specific gizmo mode (translation, rotation, scaling). When you click on one of them you can then click on a node in the Scene explorer or directly in your scene and it will be controllable with a gizmo:

- The fourth action is a picker. Just pick a mesh in your scene and it will be selected in your scene explorer
- The last one will force the scene explorer to update. For performance reasons, the scene explorer is not listening to all changes that can happen on the scene so you may end up needing to refresh it manually.
Mesh actions

The mesh shortcuts are the following:
- The first action will enable the bounding box gizmo:

- The second action will show/hide the mesh.
Light actions

You can use the light action to turn a light on and off.
Camera actions

You can use the camera action to switch the active camera (when they are multiple cameras in a scene).
GUI control actions

You can use the GUI control actions to:
- Display outline of a control
- Show / hide a specific control
Rendering pipeline actions

When your scene does not contain a default rendering pipeline, you can right-click on the rendering pipelines node to get a context menu letting you create a new default rendering pipeline.
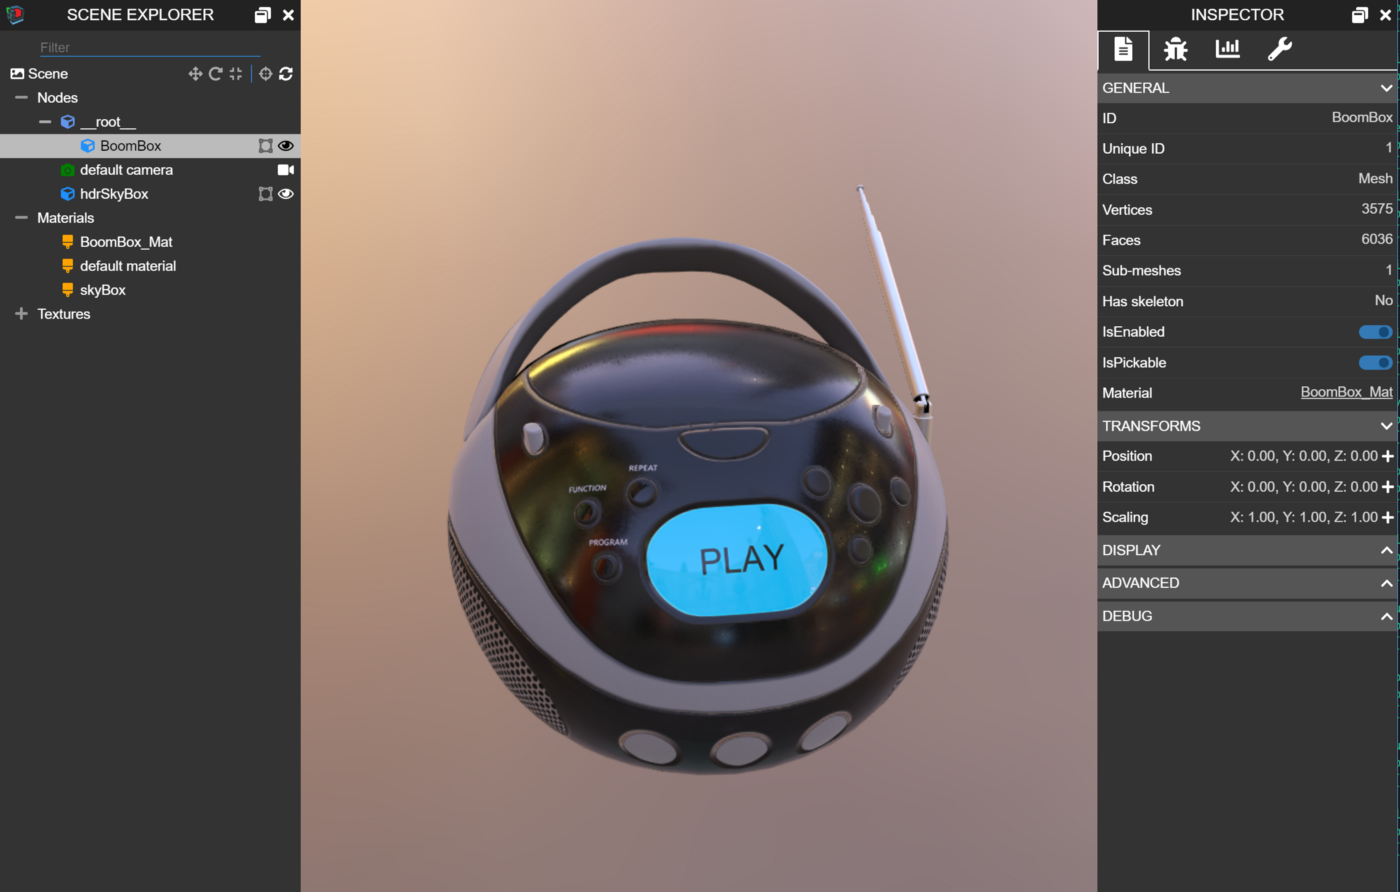
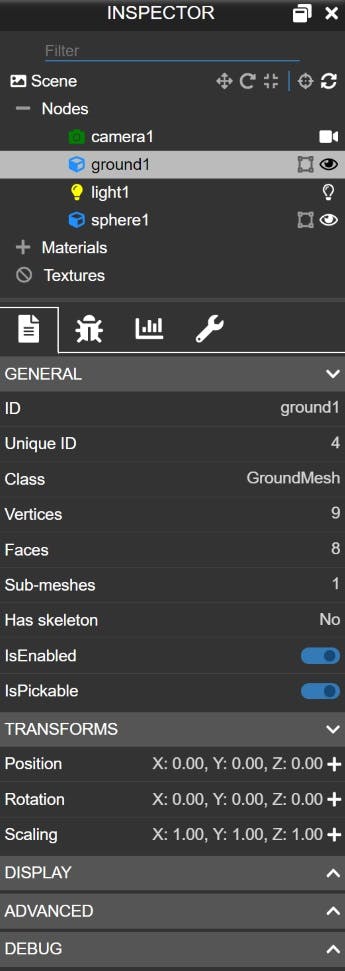
Inspector pane
The inspector pane contains 4 tabs:
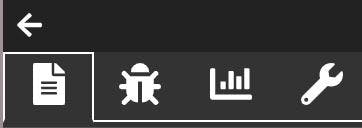
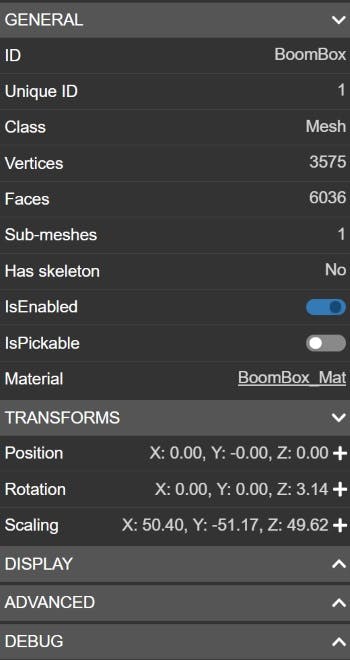
- The property grid which will display configurable controls for the current selected entity:
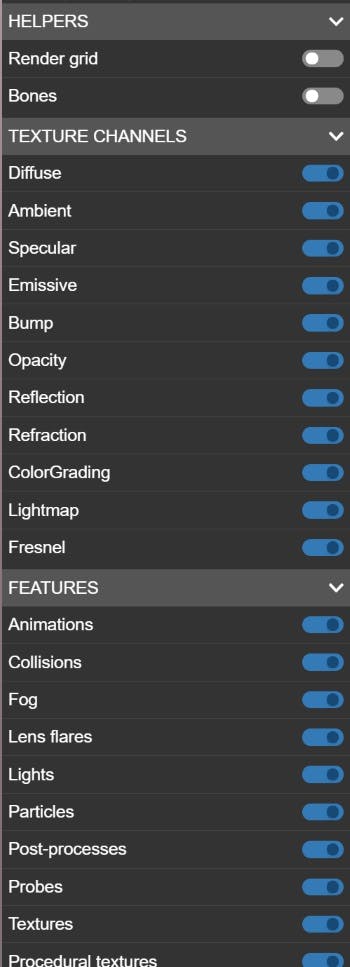
- The debug pane will let you turn features on and off. It also let you display a grid and turn viewers (bones or physics) on and off:
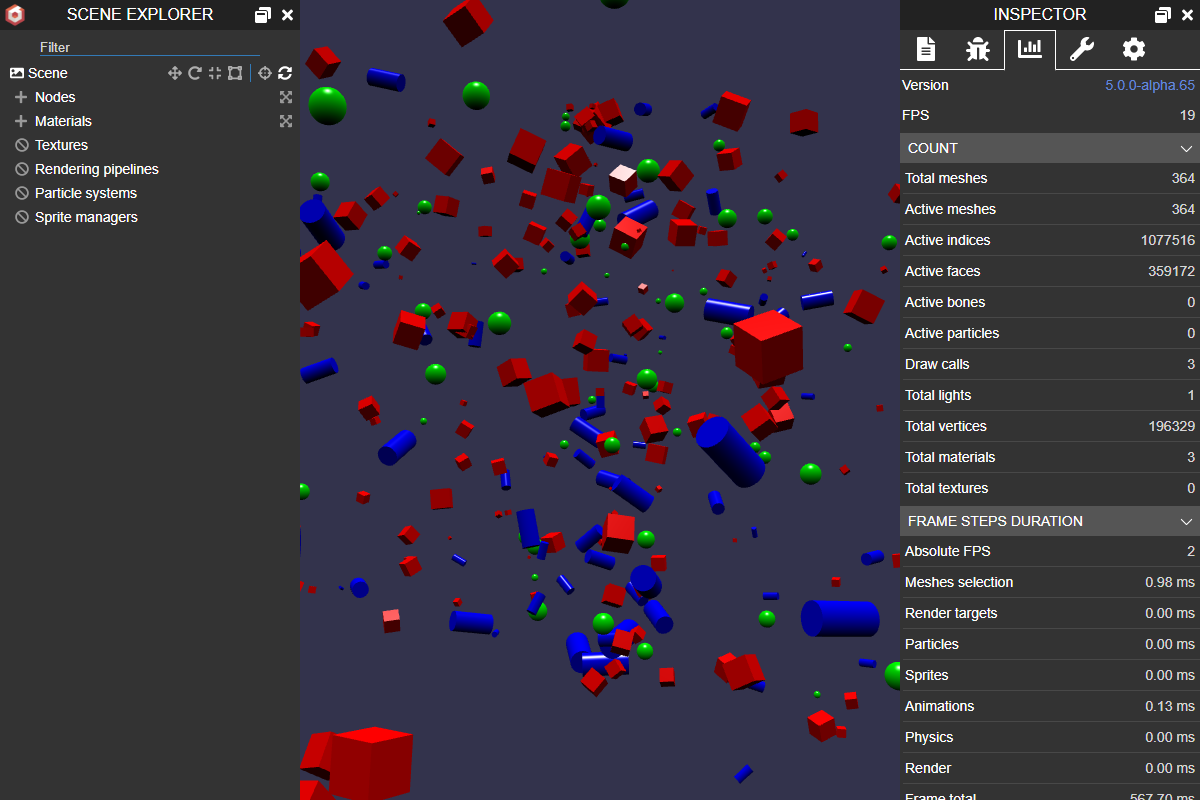
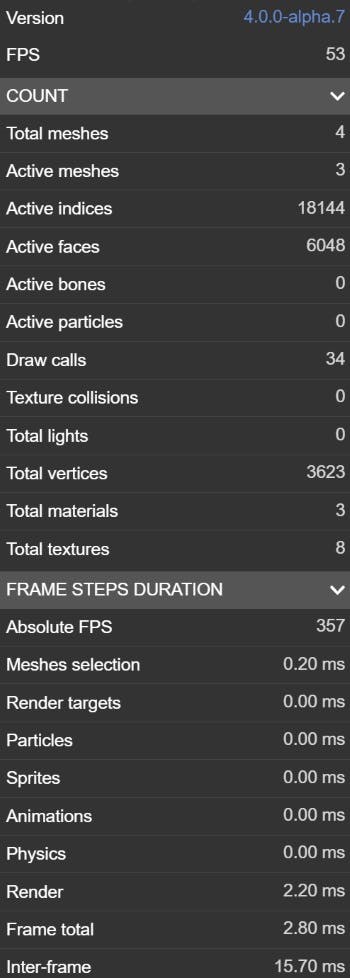
- The statistics pane gives information about all metrics captured by the engine:
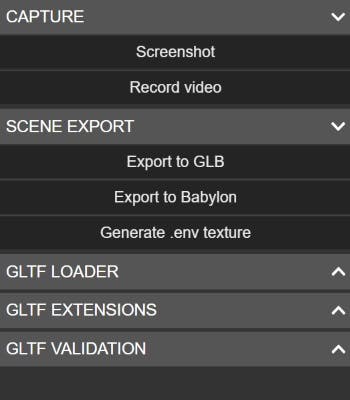
- The tools pane lets you access utilities (like screen capture or recording as well as several tools related to glTF):
Popup mode
You can move any pane into a popup mode by clicking the icon right left to the close button in the pane header:
Specific debug tools
Specific debug tools can be found across the inspector:
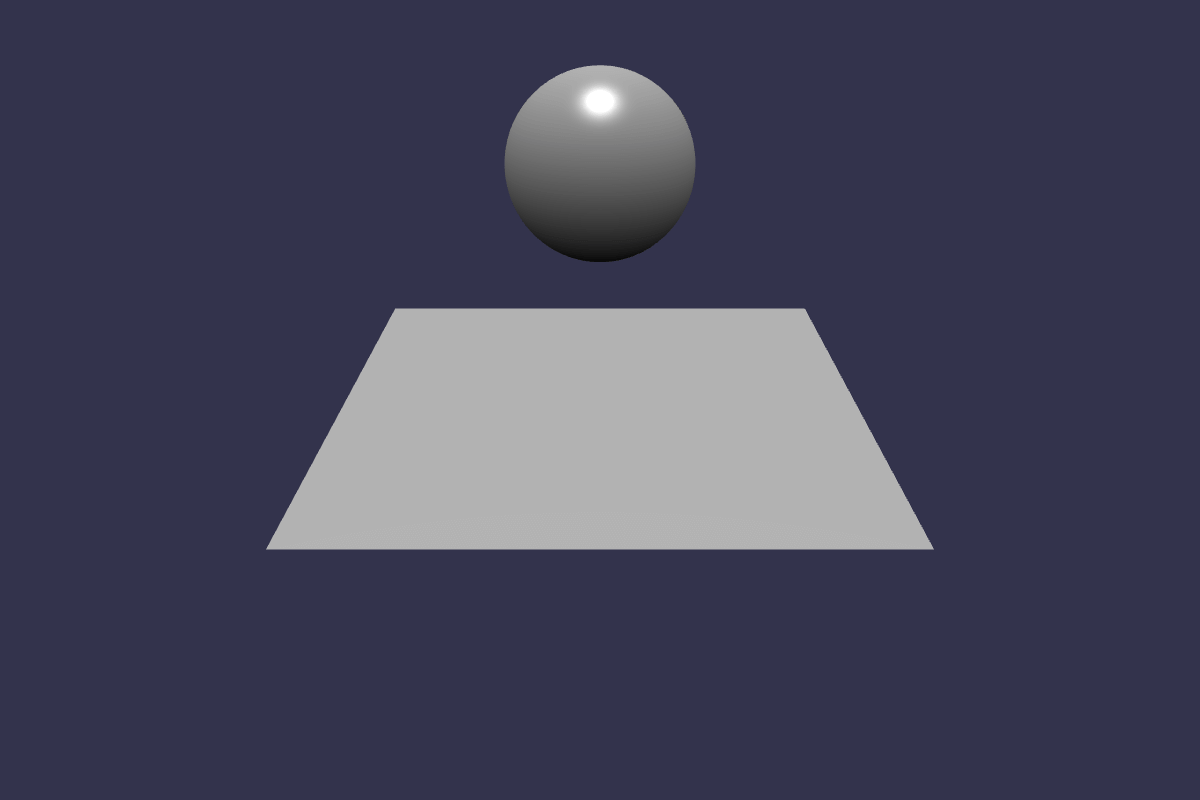
Render grid
This tool (available in the Debug pane) will render a grid on the (0,0,0) plane:

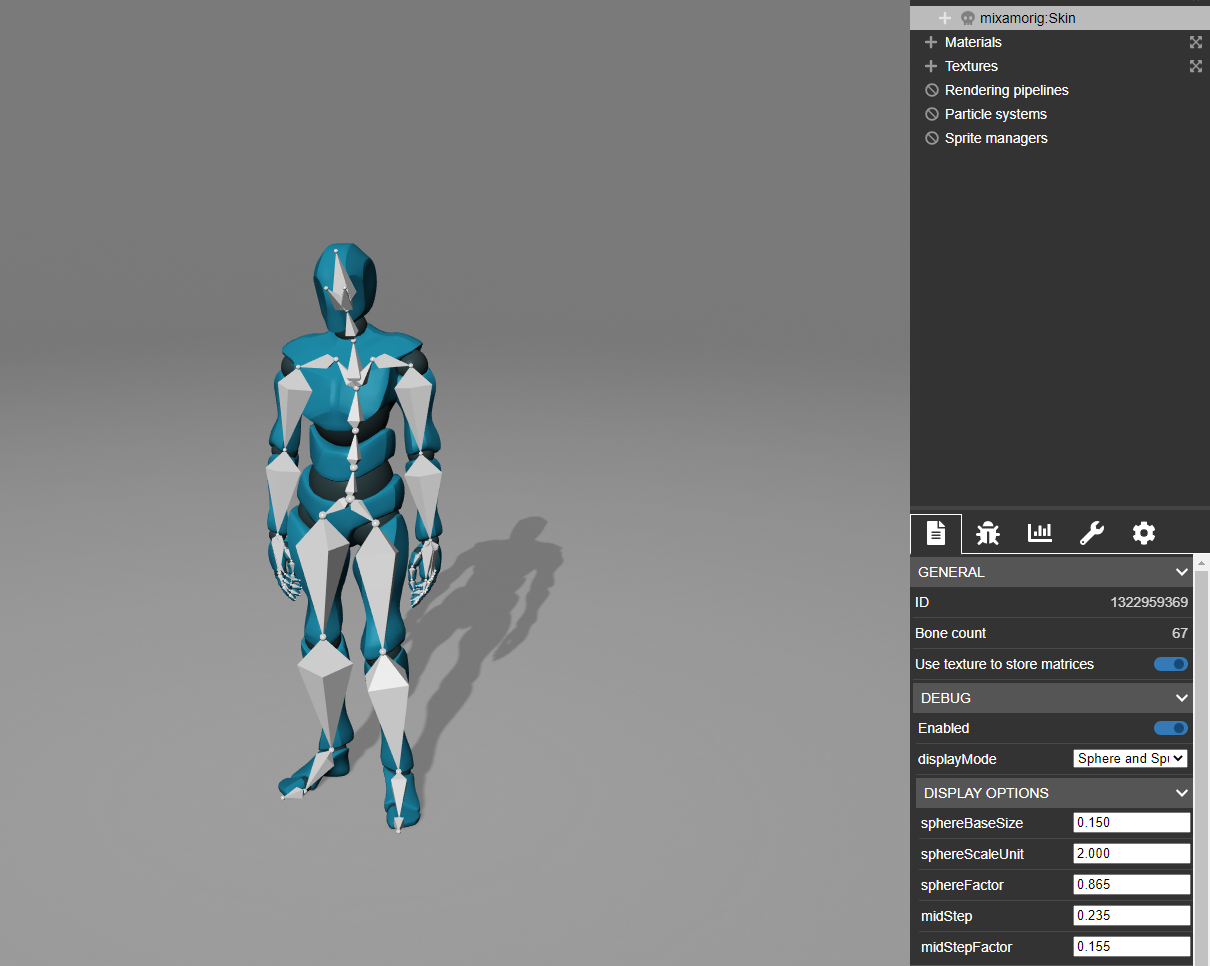
Bones viewer
This tool (available in the skeleton property grid) will render your skeletons:
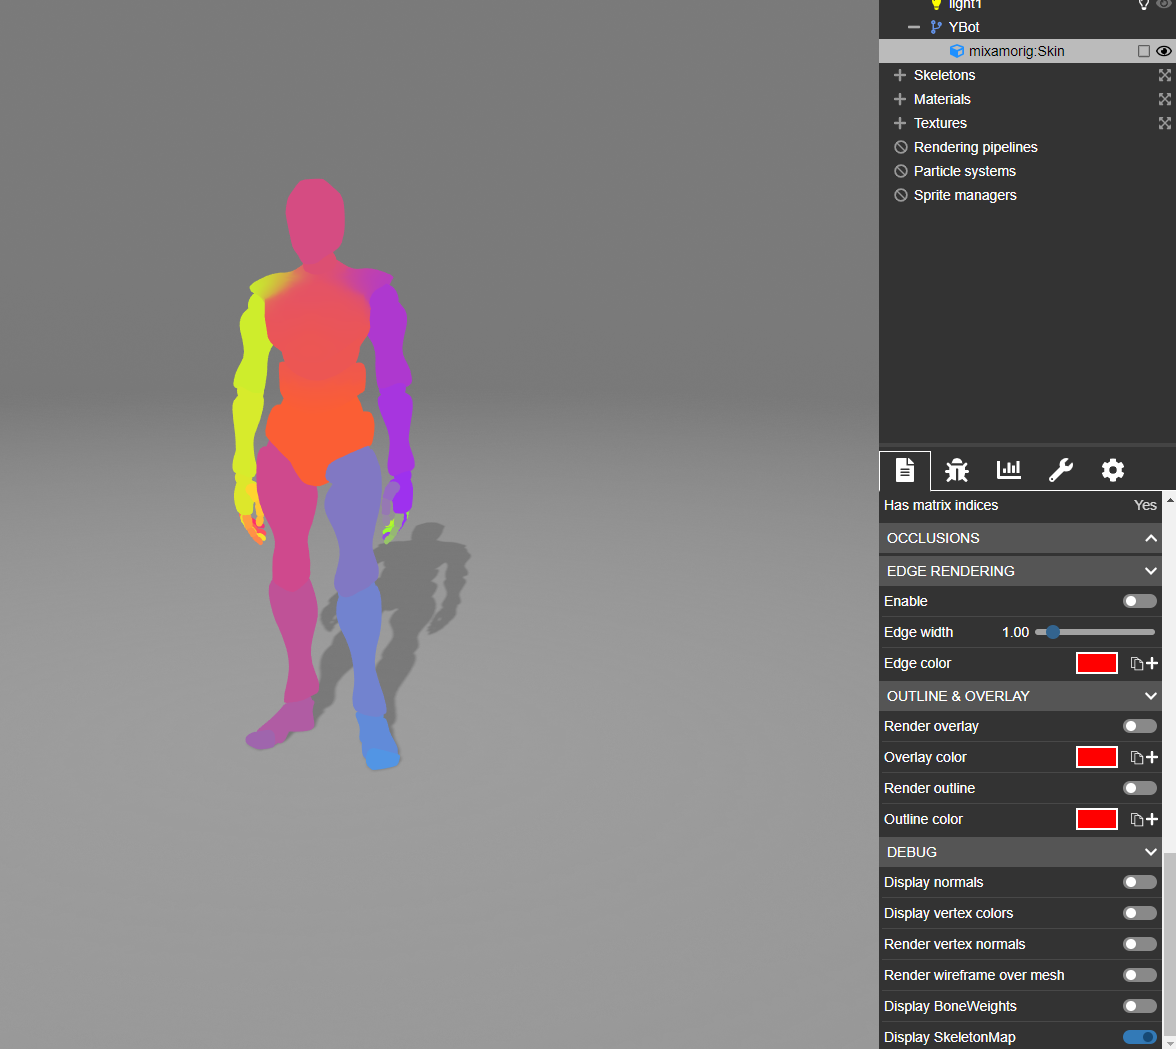
Skeleton Map Shader
This tool (available in the mesh property grid when the mesh has an attached skeleton) will render a unique color on the mesh, for each bone, showing their total contribution:
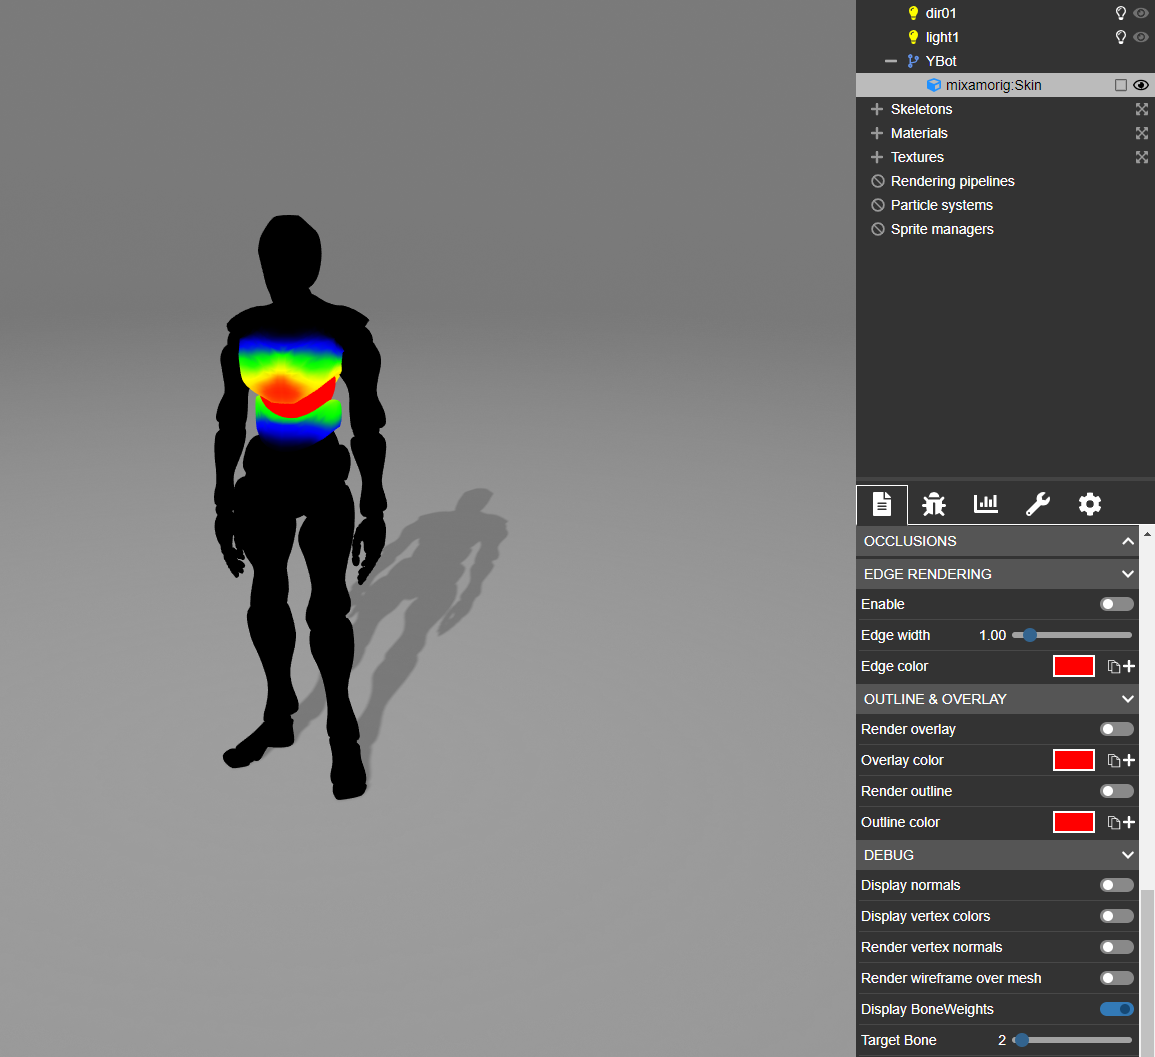
Bone Weight Shader
This tool (available in the mesh property grid when the mesh has an attached skeleton) will render a heat map showing the selected bones contribution:
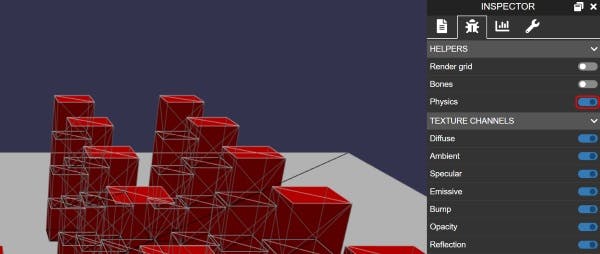
Physics viewer
This tool (available in the Debug pane) will render your physics impostors:
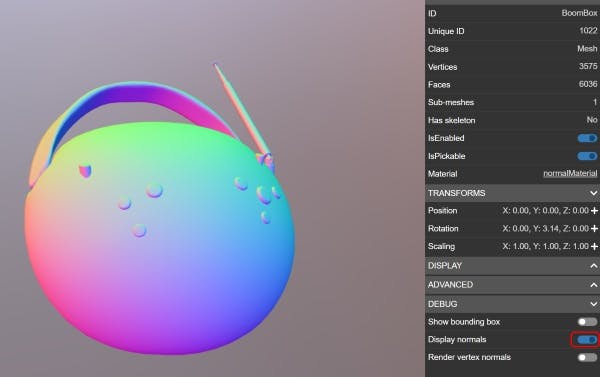
Normal painter
This tool (available in the property pane when you select a mesh) will paint the normals on your active mesh:
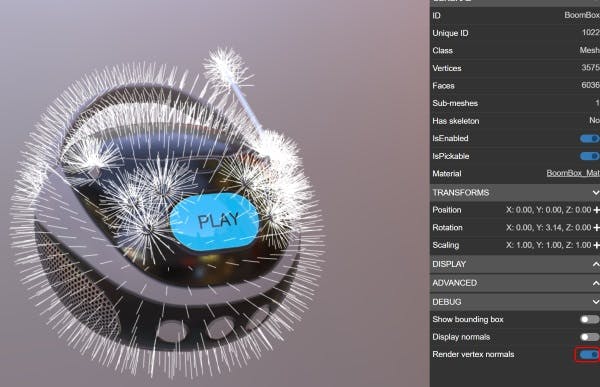
Vertex normal viewer
This tool (available in the property pane when you select a mesh) will render the vertex normals of a mesh:
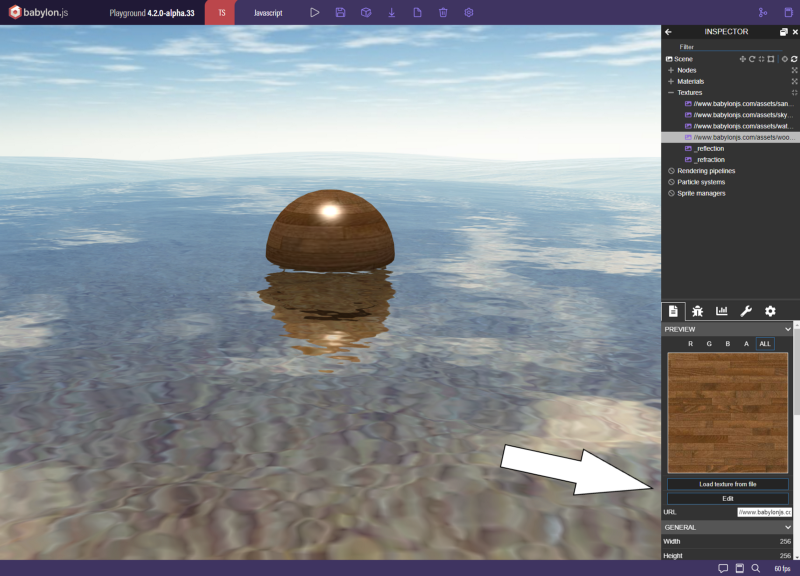
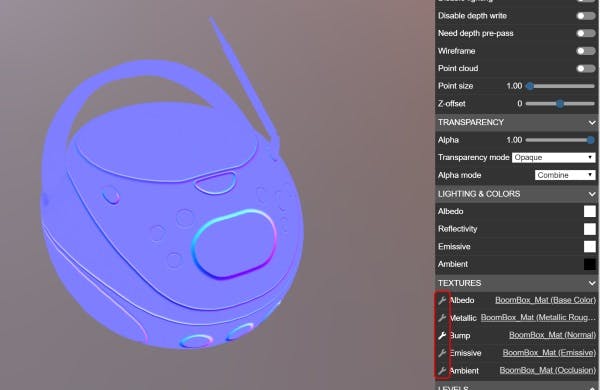
Texture painter
This tool (available in the property pane when you select a material with textures in it) will render the texture directly as an emissive one:
Extensibility
The inspector can be easily extended to allow manipulation of custom node properties. Simply define your custom properties in the node's inspectableCustomProperties array, and they will be available under the CUSTOM heading after selecting the node in the inspector.
myNode.inspectableCustomProperties = [{label: "My boolean field",propertyName: "myBooleanField",type: BABYLON.InspectableType.Checkbox,},{label: "My color field",propertyName: "myColor3Field",type: BABYLON.InspectableType.Color3,},{label: "My quaternion field",propertyName: "myQuaternionField",type: BABYLON.InspectableType.Quaternion,},{label: "My numeric range field",propertyName: "myRangeField",type: BABYLON.InspectableType.Slider,min: 0.5,max: 5.0,step: 0.1,},{label: "My string field",propertyName: "myStringField",type: BABYLON.InspectableType.String,},{label: "My vector field",propertyName: "myVector3Field",type: BABYLON.InspectableType.Vector3,},{label: "My tab field",type: BABYLON.InspectableType.Tab,},{label: "My options field",propertyName: "myOptionsField",options: [{{ label: "options1", value: 1 },{ label: "options2", value: 2 }}],callback: (option)=>{},type: BABYLON.InspectableType.Options,},{label: "My button field",propertyName: "myButtonField",callback: ()=>{},type: BABYLON.InspectableType.Button,}];